Community Sport Charitable Sport Foundations are an existing network for social impact interventions via activity and education in the most deprived communities where the need is greatest
The national geography of deprivation & inequality is a patchwork. In the UK, geographic, economic and cultural context and history mostly places deprivation in ‘clusters’ within inner city or metropolitan regions.
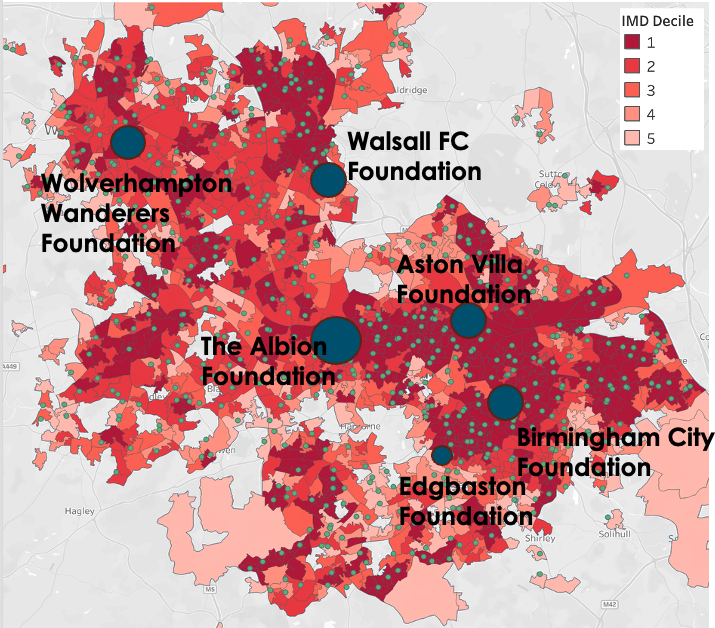
The map example show the West Midlands ‘metropolitan’ area where 90% of ~2M total population (including 250k primary school children) live in communities that are in IMD Deciles 1-5 - coloured in red scale with darkest most deprived - and so in the most deprived 50% nationally.
Community Sport organisations – including the 6 CSFs shown - are an existing network of place-based delivery partners for social impact interventions within their local catchments. Community sport organisations are of course so much more than ‘just sport’ - as a vector for broader social good - education, health and wellbeing, employment and social cohesion.
*Map uses 2019 ONS LSOA 'neighbourhoods' and IMD (Indices Multiple Deprivation) - Decile 1 is 'most deprived' 10% nationally, coloured red to Decile 5. Primary schools are also shown as green dots.
A note or visual perception warning… in any ‘coloured’ or shaded polygon map where polygons are sized for equal population, as is the case for the LSOAs used here, the more densely populated urban areas are ‘smaller’ in area, where the less densely populated rural areas look visually more impactful. A familiar example are the ‘election night’ maps for UK Parliamentary elections, where Conservative ‘blue’ looks visually more dominant as the Labour ‘red’ is clustered in smaller, metropolitan areas.